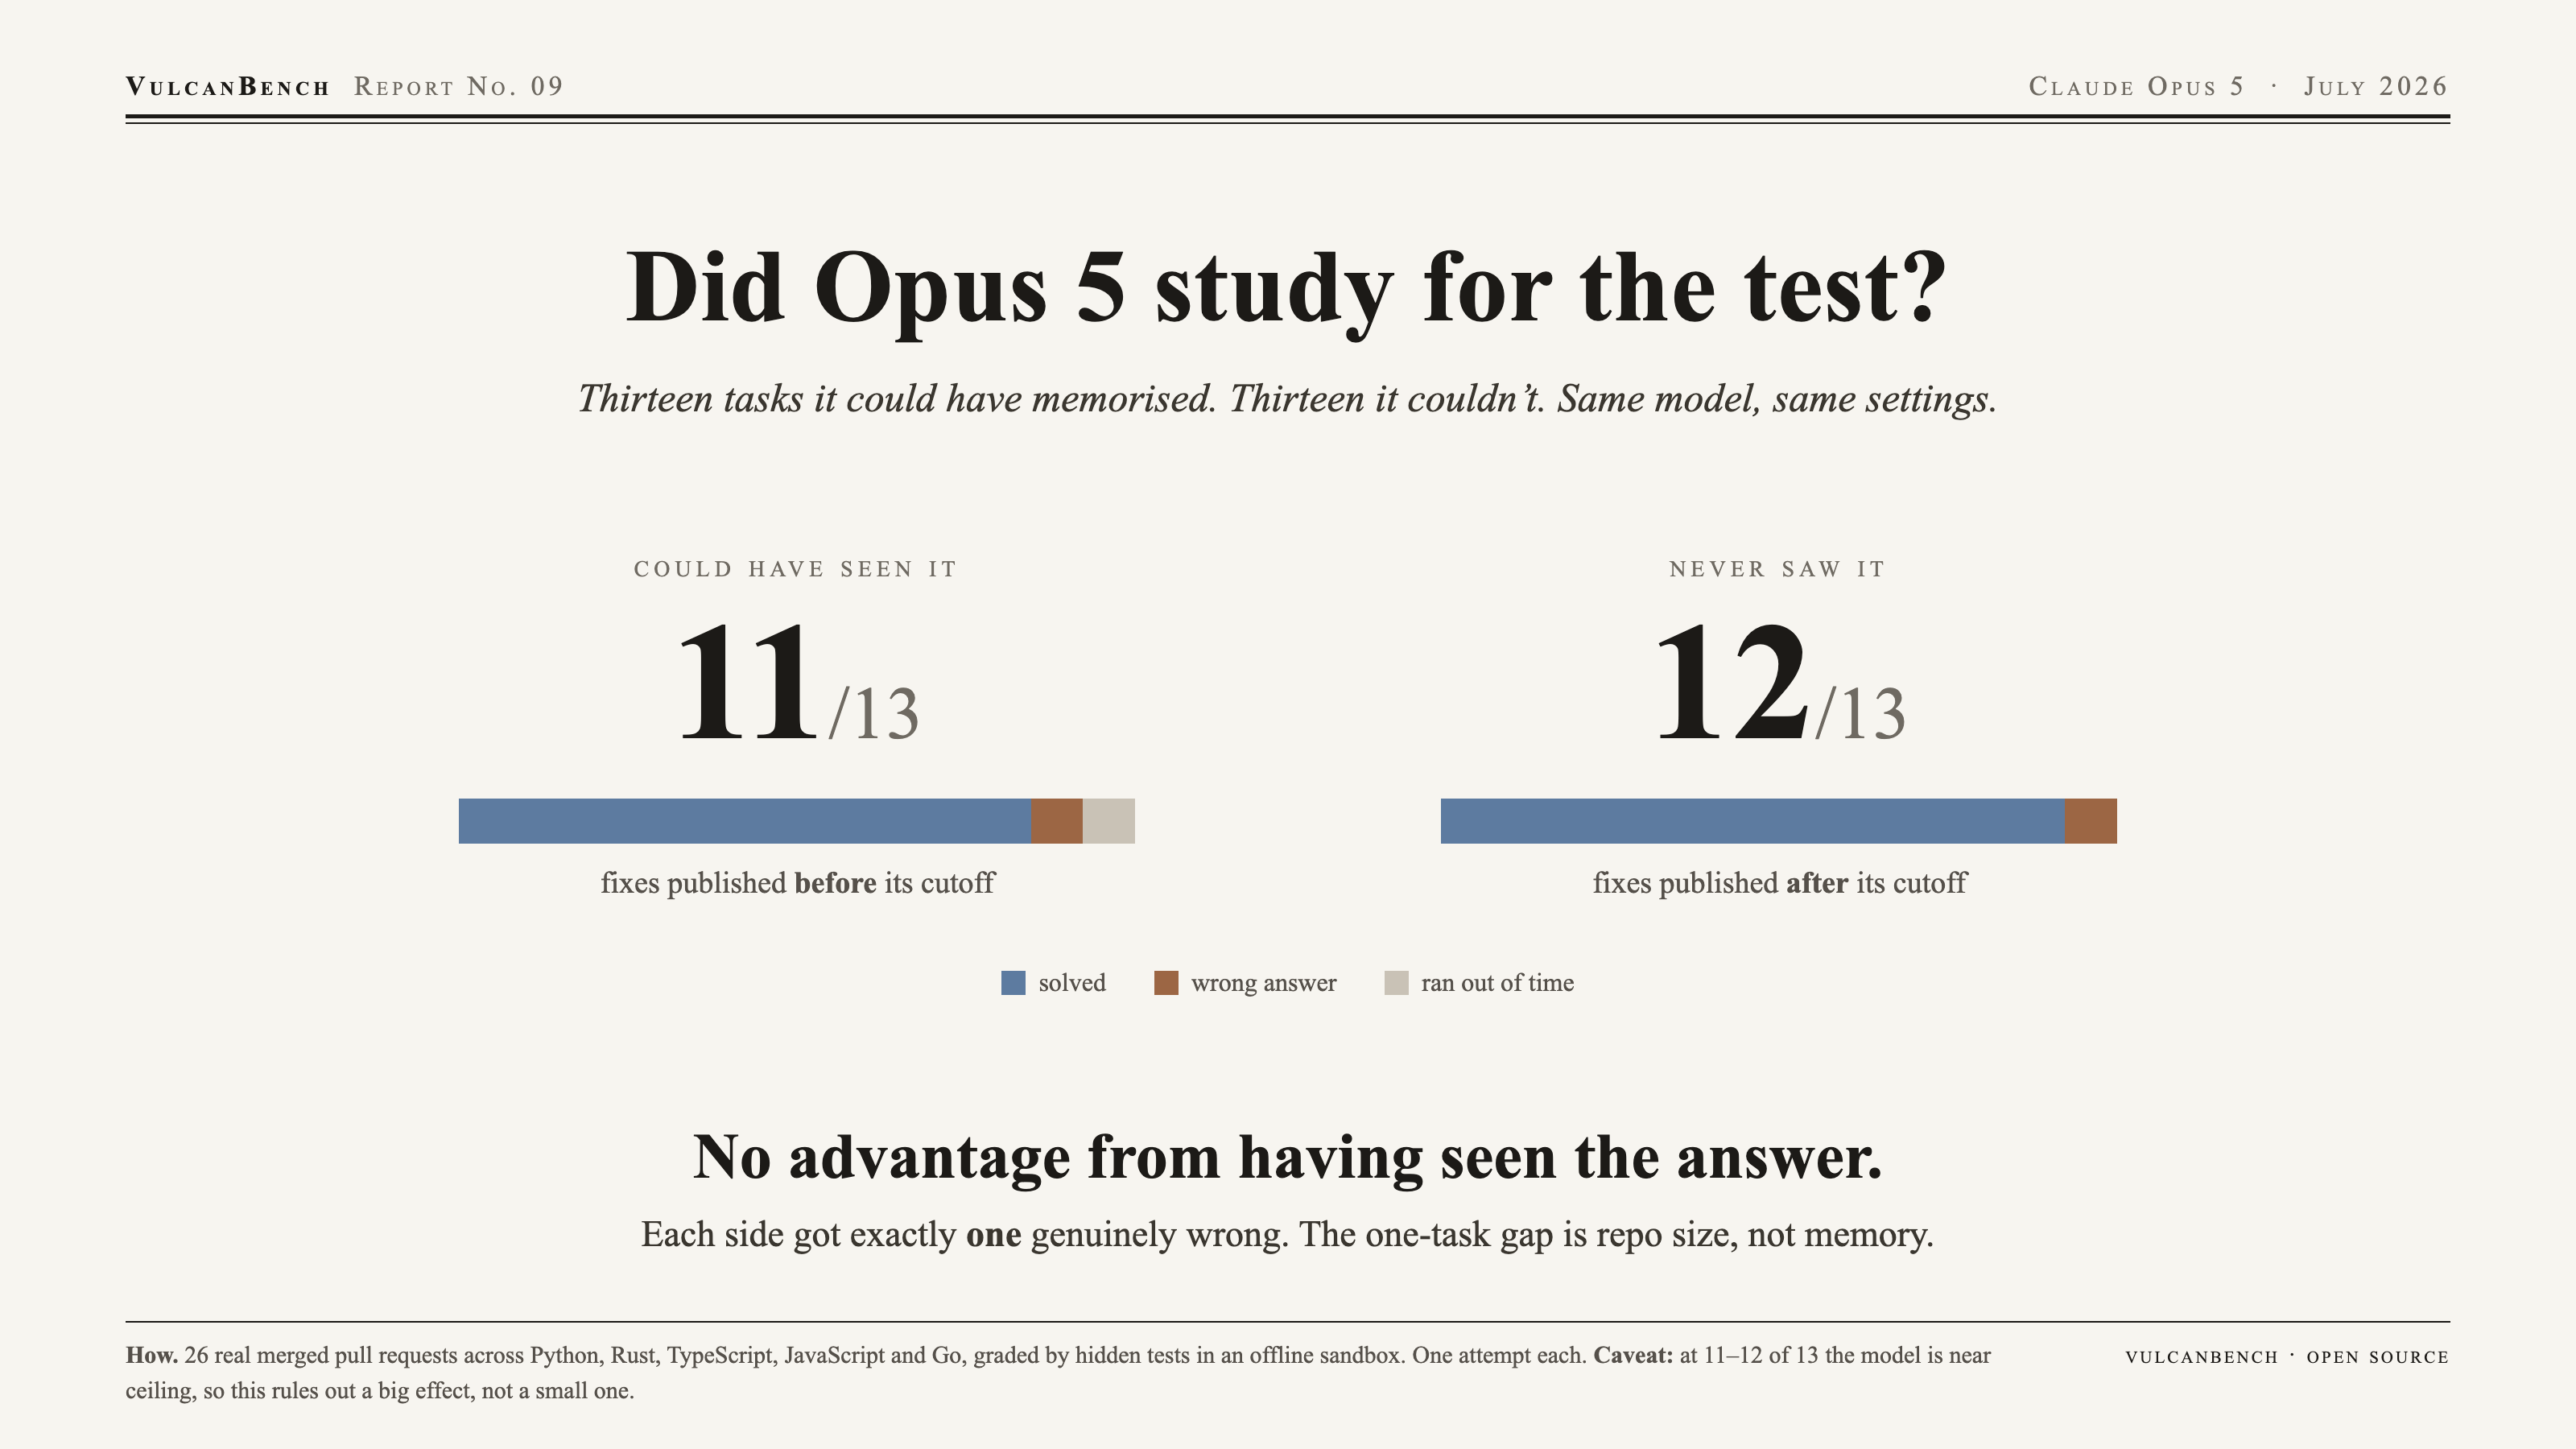
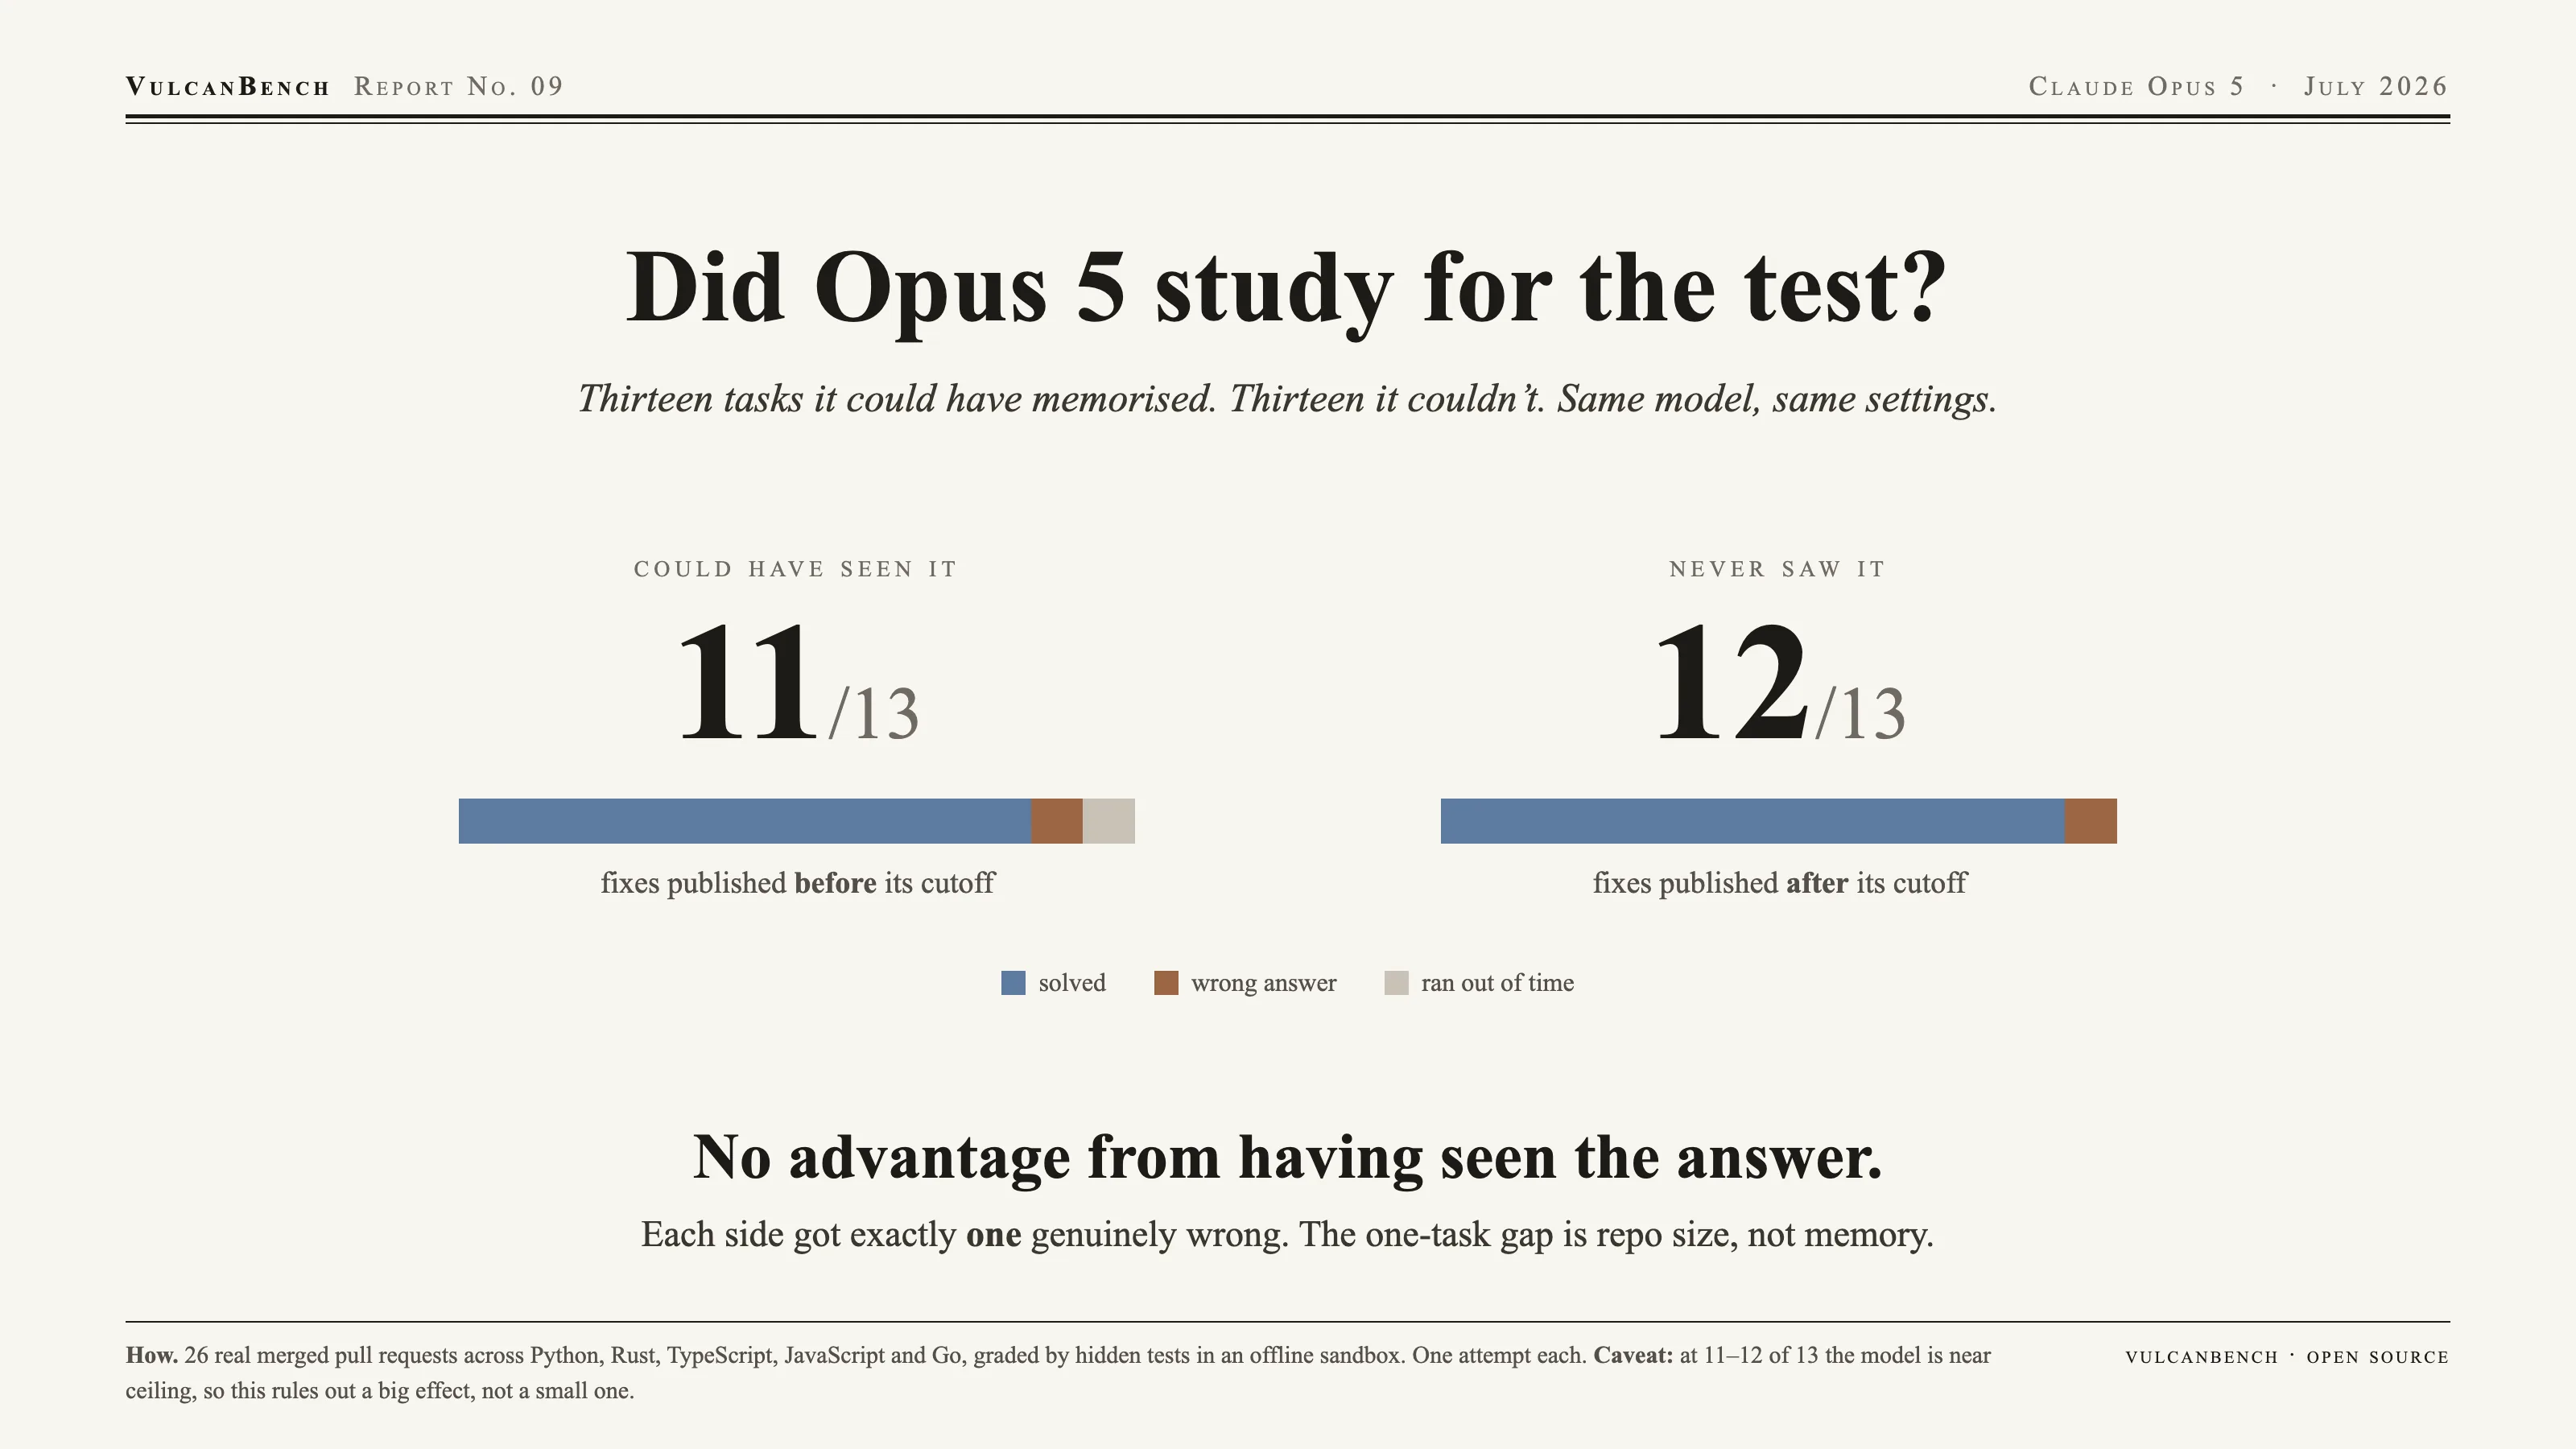
No detectable contamination effect: the arm Opus 5 could have memorised scores 11/13; the arm it cannot have seen scores 12/13: one genuine wrong answer each. The visible one-task gap is repo-scale composition, not memory. At 11 to 12 of 13 the model is near ceiling, so this rules out a large effect, not a small one, and getting to the null took four harness fixes that had been masquerading as signal.
| Arm | Score | pass@1 | Genuine misses | Hit wall-clock | Cost | Tokens/task | Time/task | $/solved |
|---|---|---|---|---|---|---|---|---|
| Clean (post-cutoff) | 12/13 | 92.3% | 1 | 0 | $4.58 | 38 K | 4.7 min | $0.38 |
| Contaminated (pre-cutoff) | 11/13 | 84.6% | 1 | 1 | $16.36 | 121 K | 9.4 min | $1.49 |
Claude Opus 5, medium effort, one attempt per task. Genuine misses completed and produced a wrong patch; hit wall-clock = still working productively when the budget expired, a different failure mode, not a statement about capability.
No detectable contamination effect. Genuine capability misses are 1 versus 1. The headline gap is a single task (7.7 pp), inside the noise floor at n=13. Memorisation of the upstream fix did not measurably help.
The visible gap is repo-scale composition, not memorisation. The contaminated arm carries 11/13 large-or-xlarge repositories against the clean arm’s 8/13, which is why the same 13-task shape cost 3.6× more and ran 2× longer per task, and why the one wall-clock loss landed there. Cross-suite comparisons must report scale mix alongside score.
Evidence against a large effect, not proof of none. At 11 to 12 of 13 the model is near ceiling, and a ceiling leaves memorisation little room to show itself. A sharper test needs harder tasks or a weaker model, not more tasks at this difficulty.
Most of the apparent signal was harness bugs. Before fixing them, the same comparison read 7/13 vs 12/13, a large gap pointing the wrong way for contamination, produced by stalled HTTP requests scored as failures. Each of four fixes moved the arms closer together; the sequence ran 7/13 → 10/13 → 11/13 against an unchanging 12/13.
| Defect | Effect on scores |
|---|---|
| Run budget passed as the per-request socket timeout, disabling retries | One stalled request consumed a whole task and scored it 0; six of 13 first-run tasks died this way |
| Request ceiling set from a pooled latency distribution | 300 s sat below a response that legitimately completed in 333 s; now 600 s |
| Infrastructure errors dropped the task instead of retrying | A tidy pass@1 over a silently smaller denominator, a different task each run |
| large and xlarge repos shared an 1800 s budget | Neither tier could spend its step allowance; now 2700 s / 3600 s |
These changed scoring behaviour. Results published before them, including Reports 04 and 08, were produced under the old semantics and are not directly comparable to this report.
Both arms graded by deterministic hidden tests in a network-isolated Docker sandbox; every task pre-validated gold = 1.0, unpatched = 0.0. The arms are committed suite manifests (pre-2026-05 in tasks/v3, new_in_v4 in tasks/v4), and every task records its upstream merge date, so the clean/contaminated split can be recomputed against any future model’s cutoff: v4 is clean for a May 2026 cutoff specifically, not indefinitely. Caveats: n=13 per arm (one task is 7.7 pp), single attempts, one model; wall-clock inflated ~2× by amd64 emulation on an arm64 host (scores unaffected).